
Thingport Activity Heatmap
Miscellaneous
Shows a year of your Thingport activity as a heatmap, like your Thingport profile.
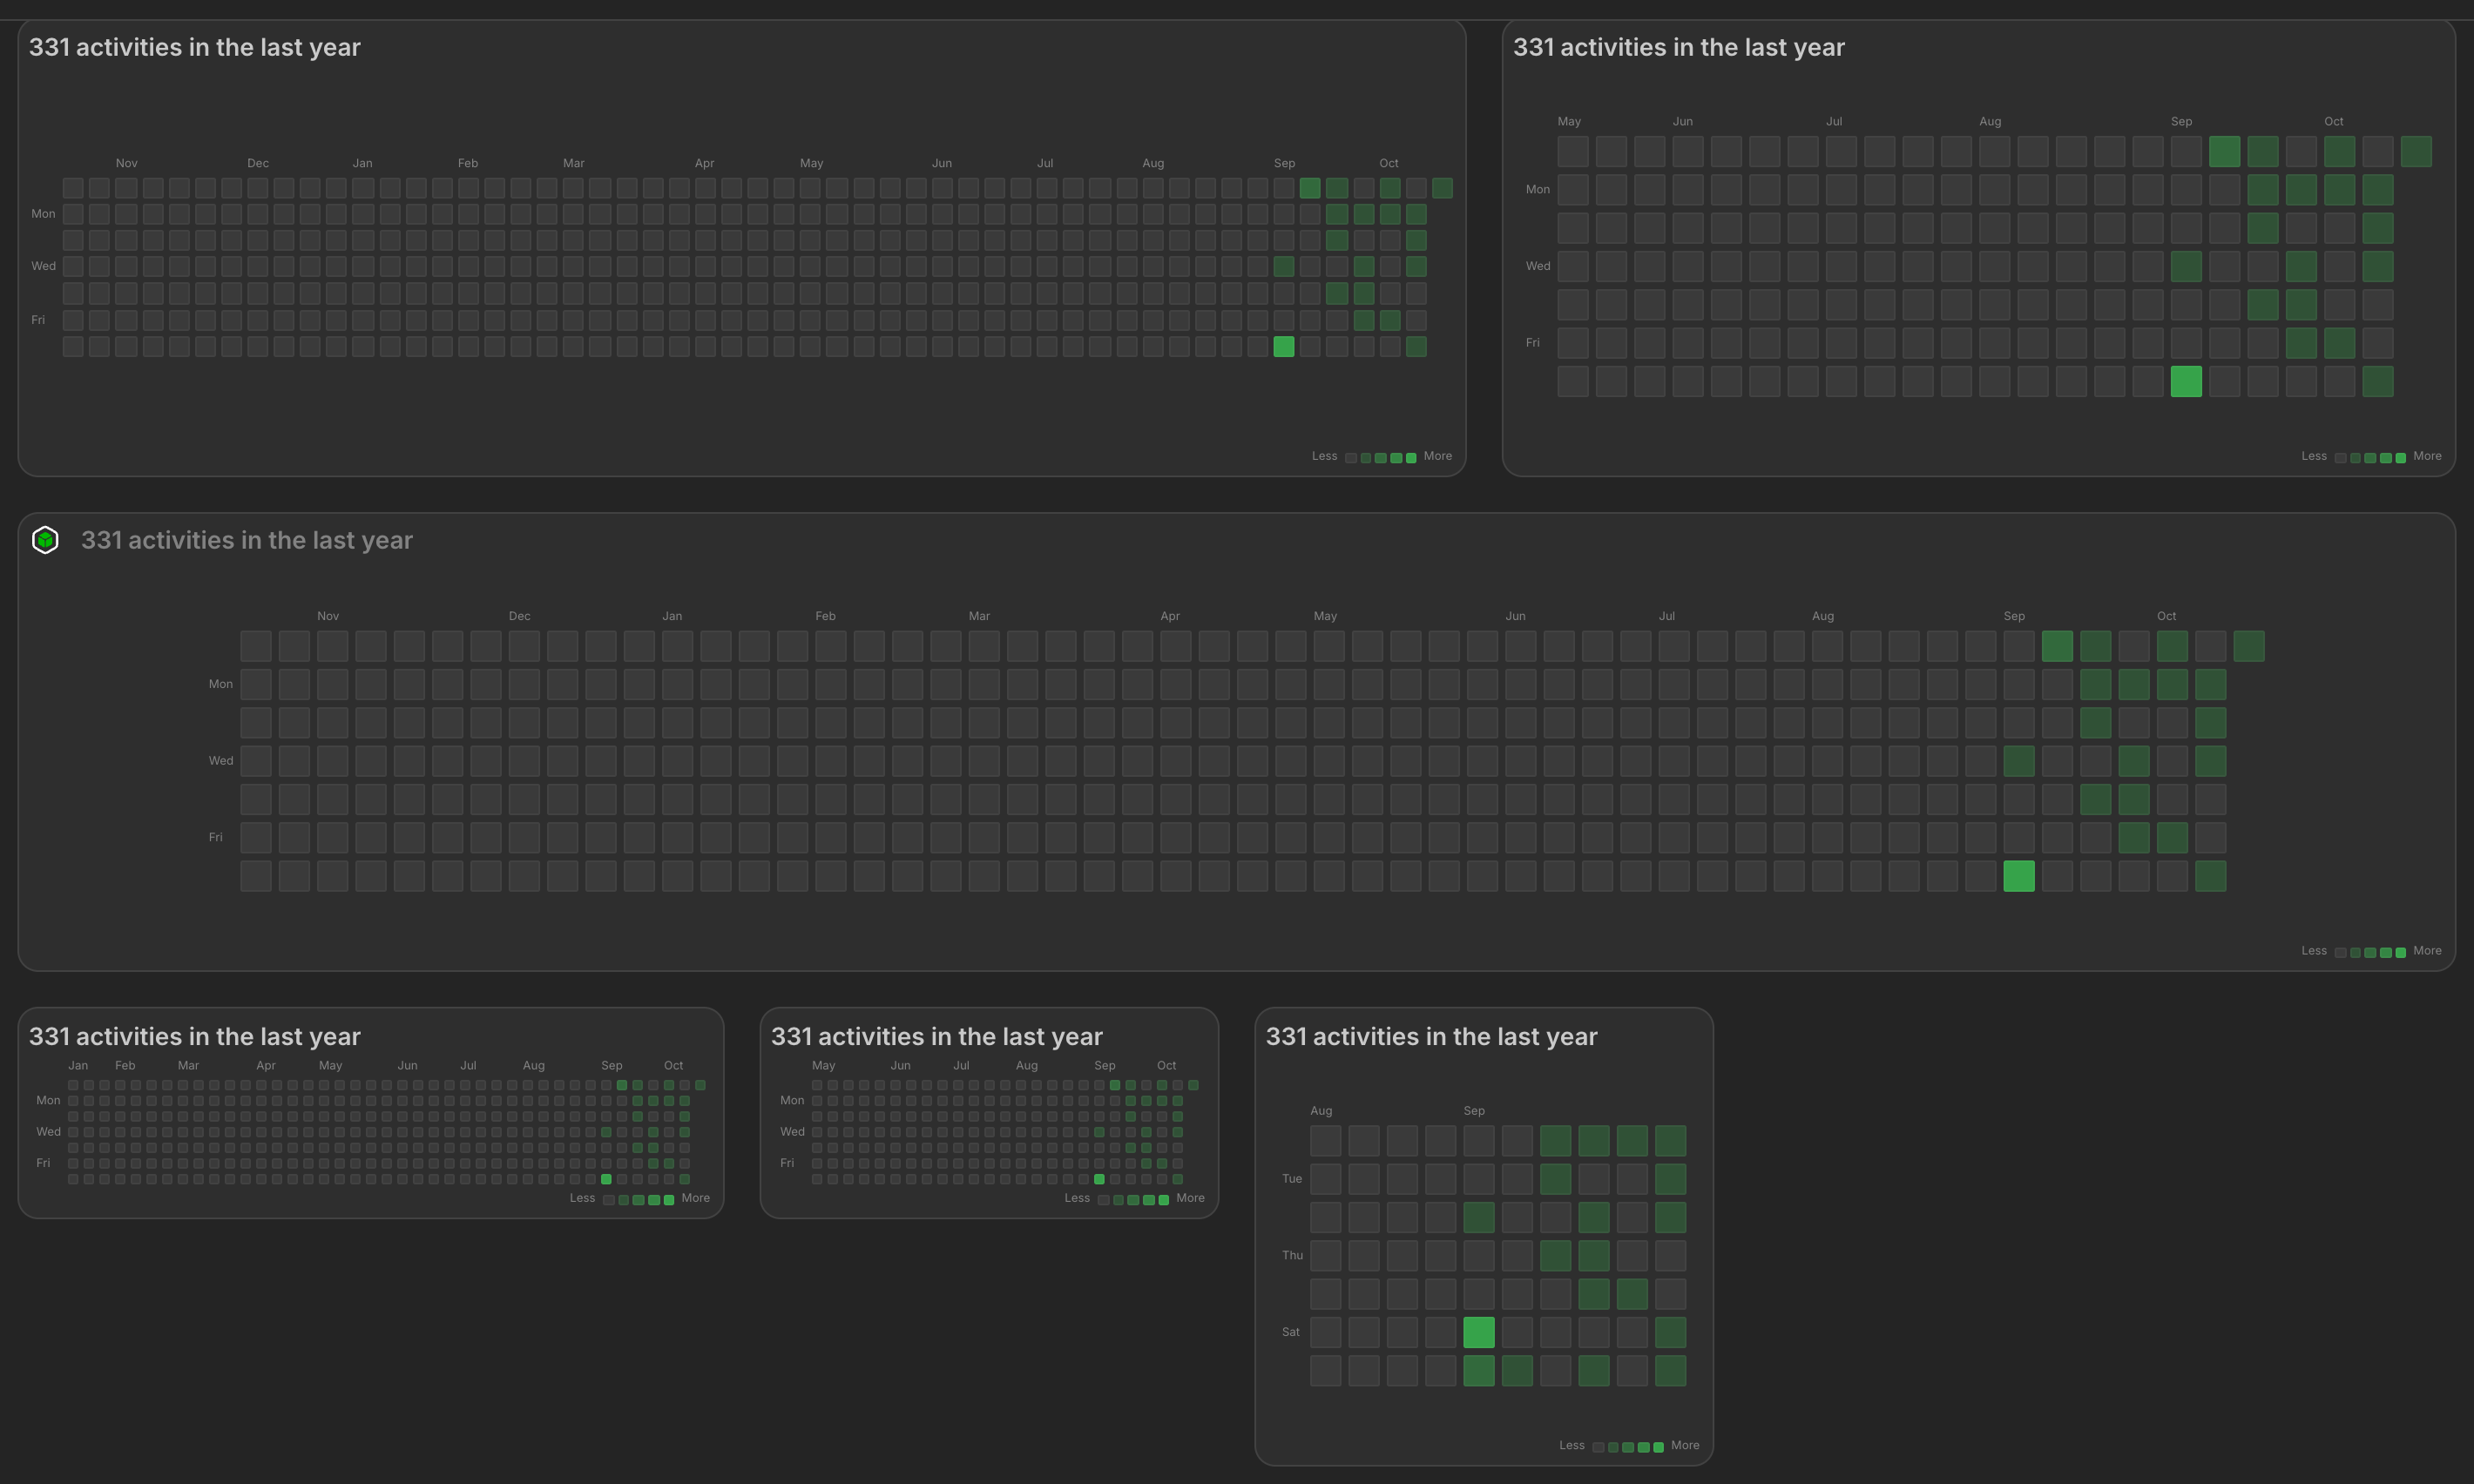
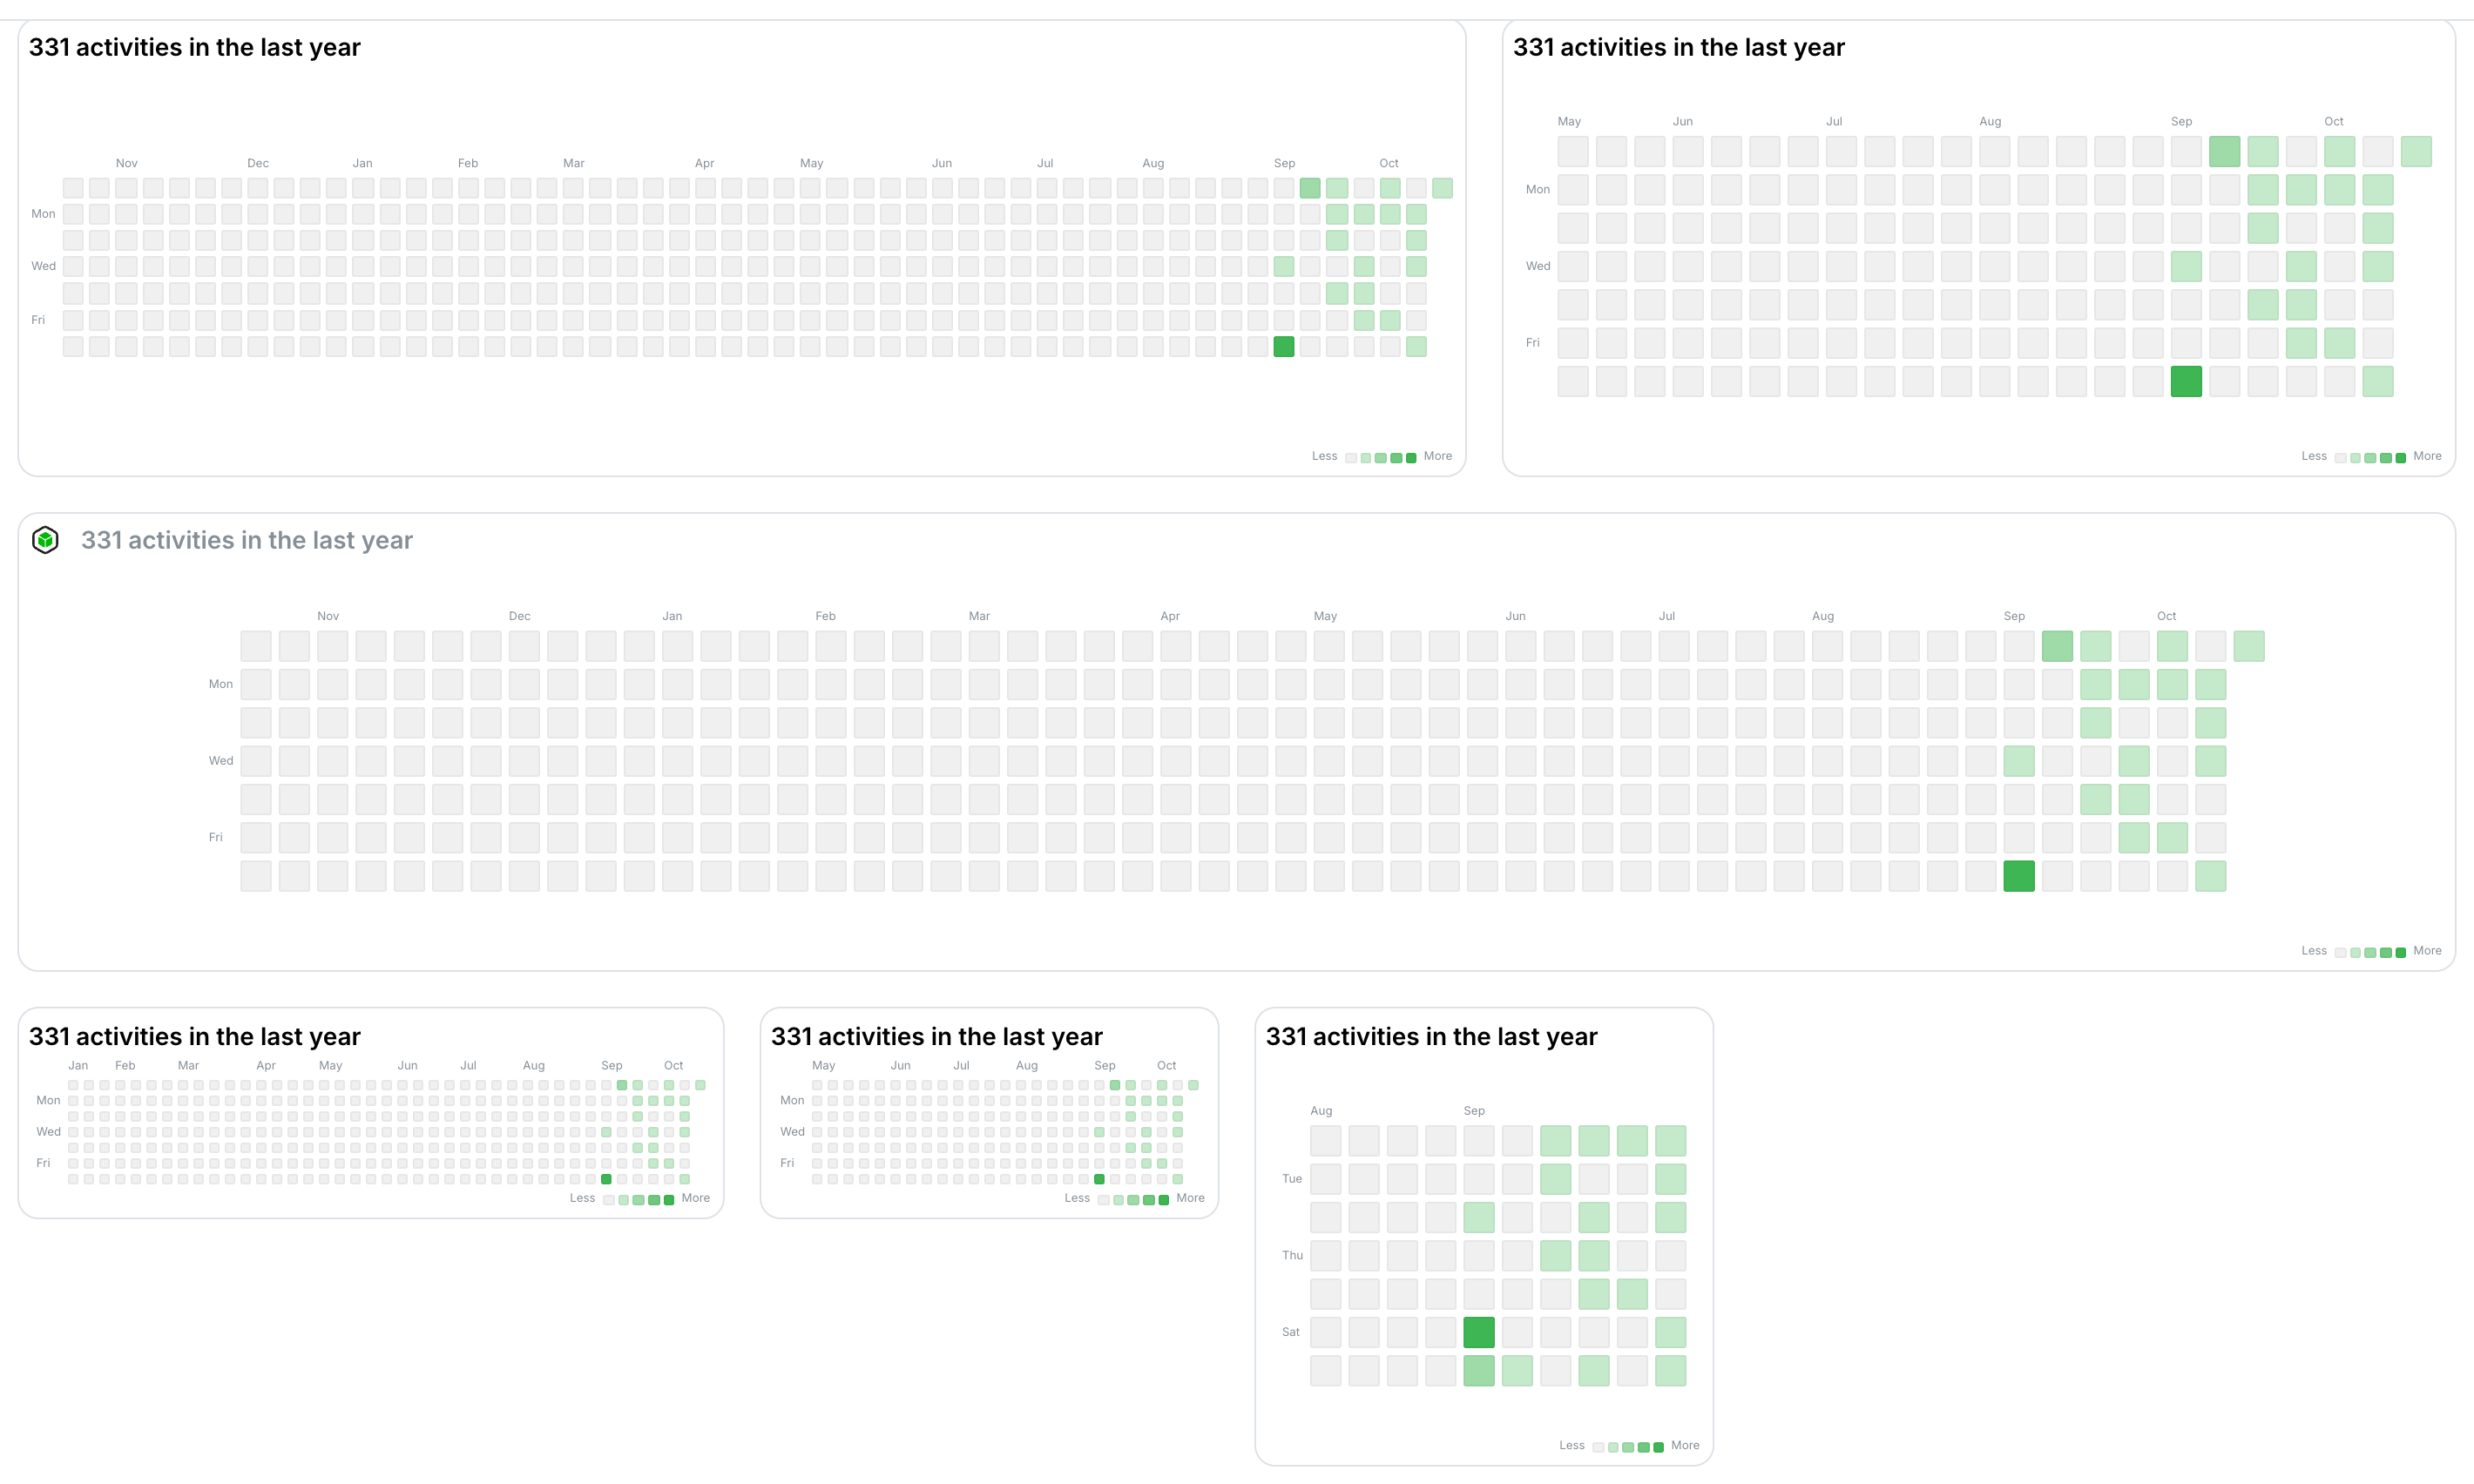
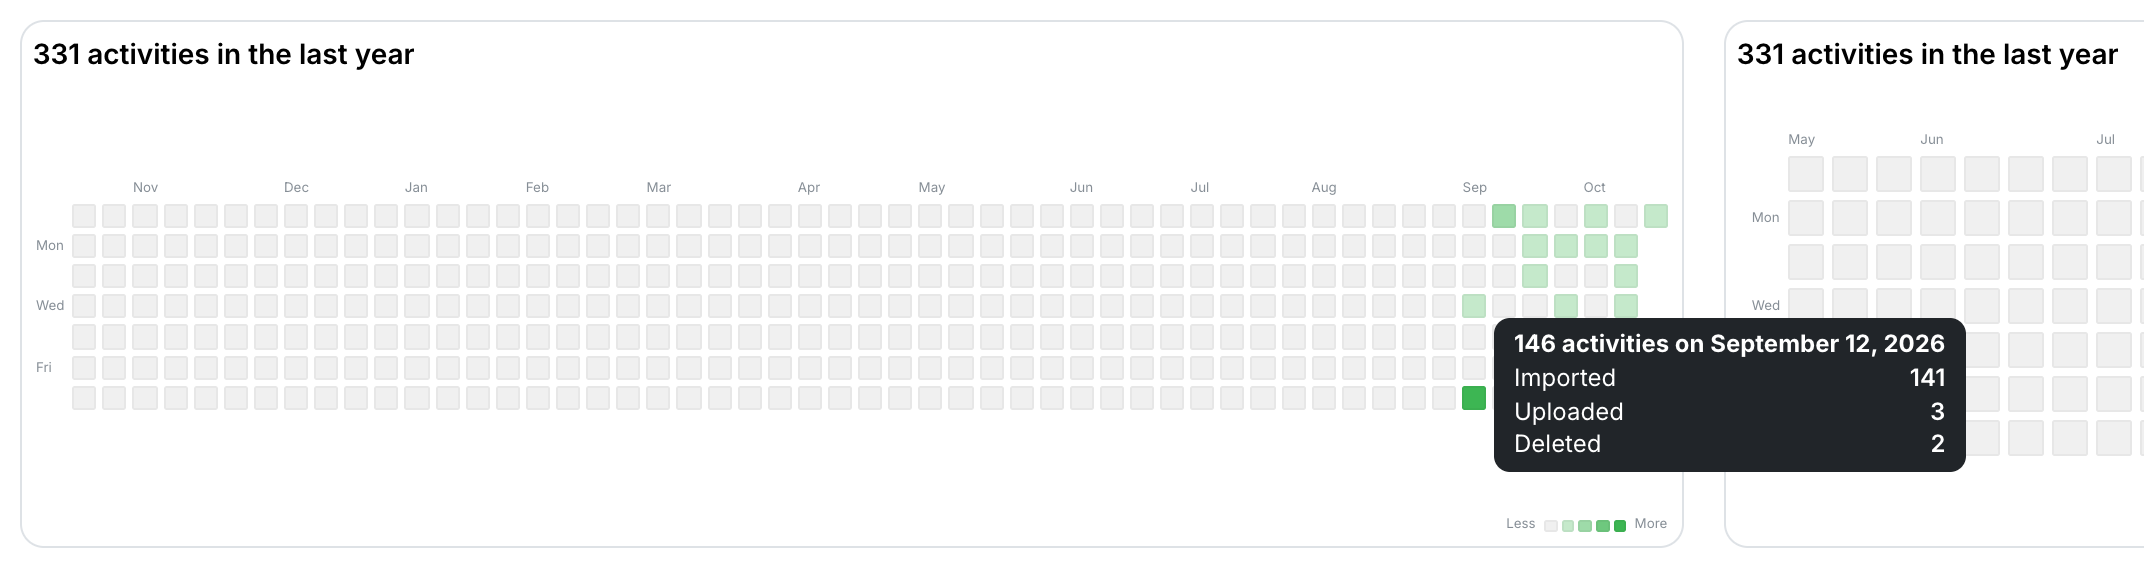
This widget shows your Thingport activity for the last 12 months, the same heatmap as on your Thingport profile. Each square is a day, and the busier the day, the darker the square. Hover over a day to see how many models you imported, uploaded, downloaded, opened in a slicer or deleted.
Use the year picker to show an earlier year. When the widget is too narrow for the whole year, it shows the most recent weeks.
Screenshots
The widget at several grid sizes, in dark and light mode.
Hovering over a day shows what happened on it.
Supported Integrations

ThingportSelf-hosted library for organizing and previewing your 3D printing models.
Adding the widget
Add the widget from the board's Add board content menu in edit mode.
Configuration
| Name | Description | Values | Default value |
|---|---|---|---|
| Show title | Displays the Thingport logo and a title above the widget | yes / no | no |
| First day of the week | The weekday each column starts on |
| Sunday |
| Show total | Displays the number of activities in the shown period | yes / no | yes |
| Show legend | Displays the less-to-more color scale | yes / no | yes |