Beszel System Stats
System MonitoringCharts
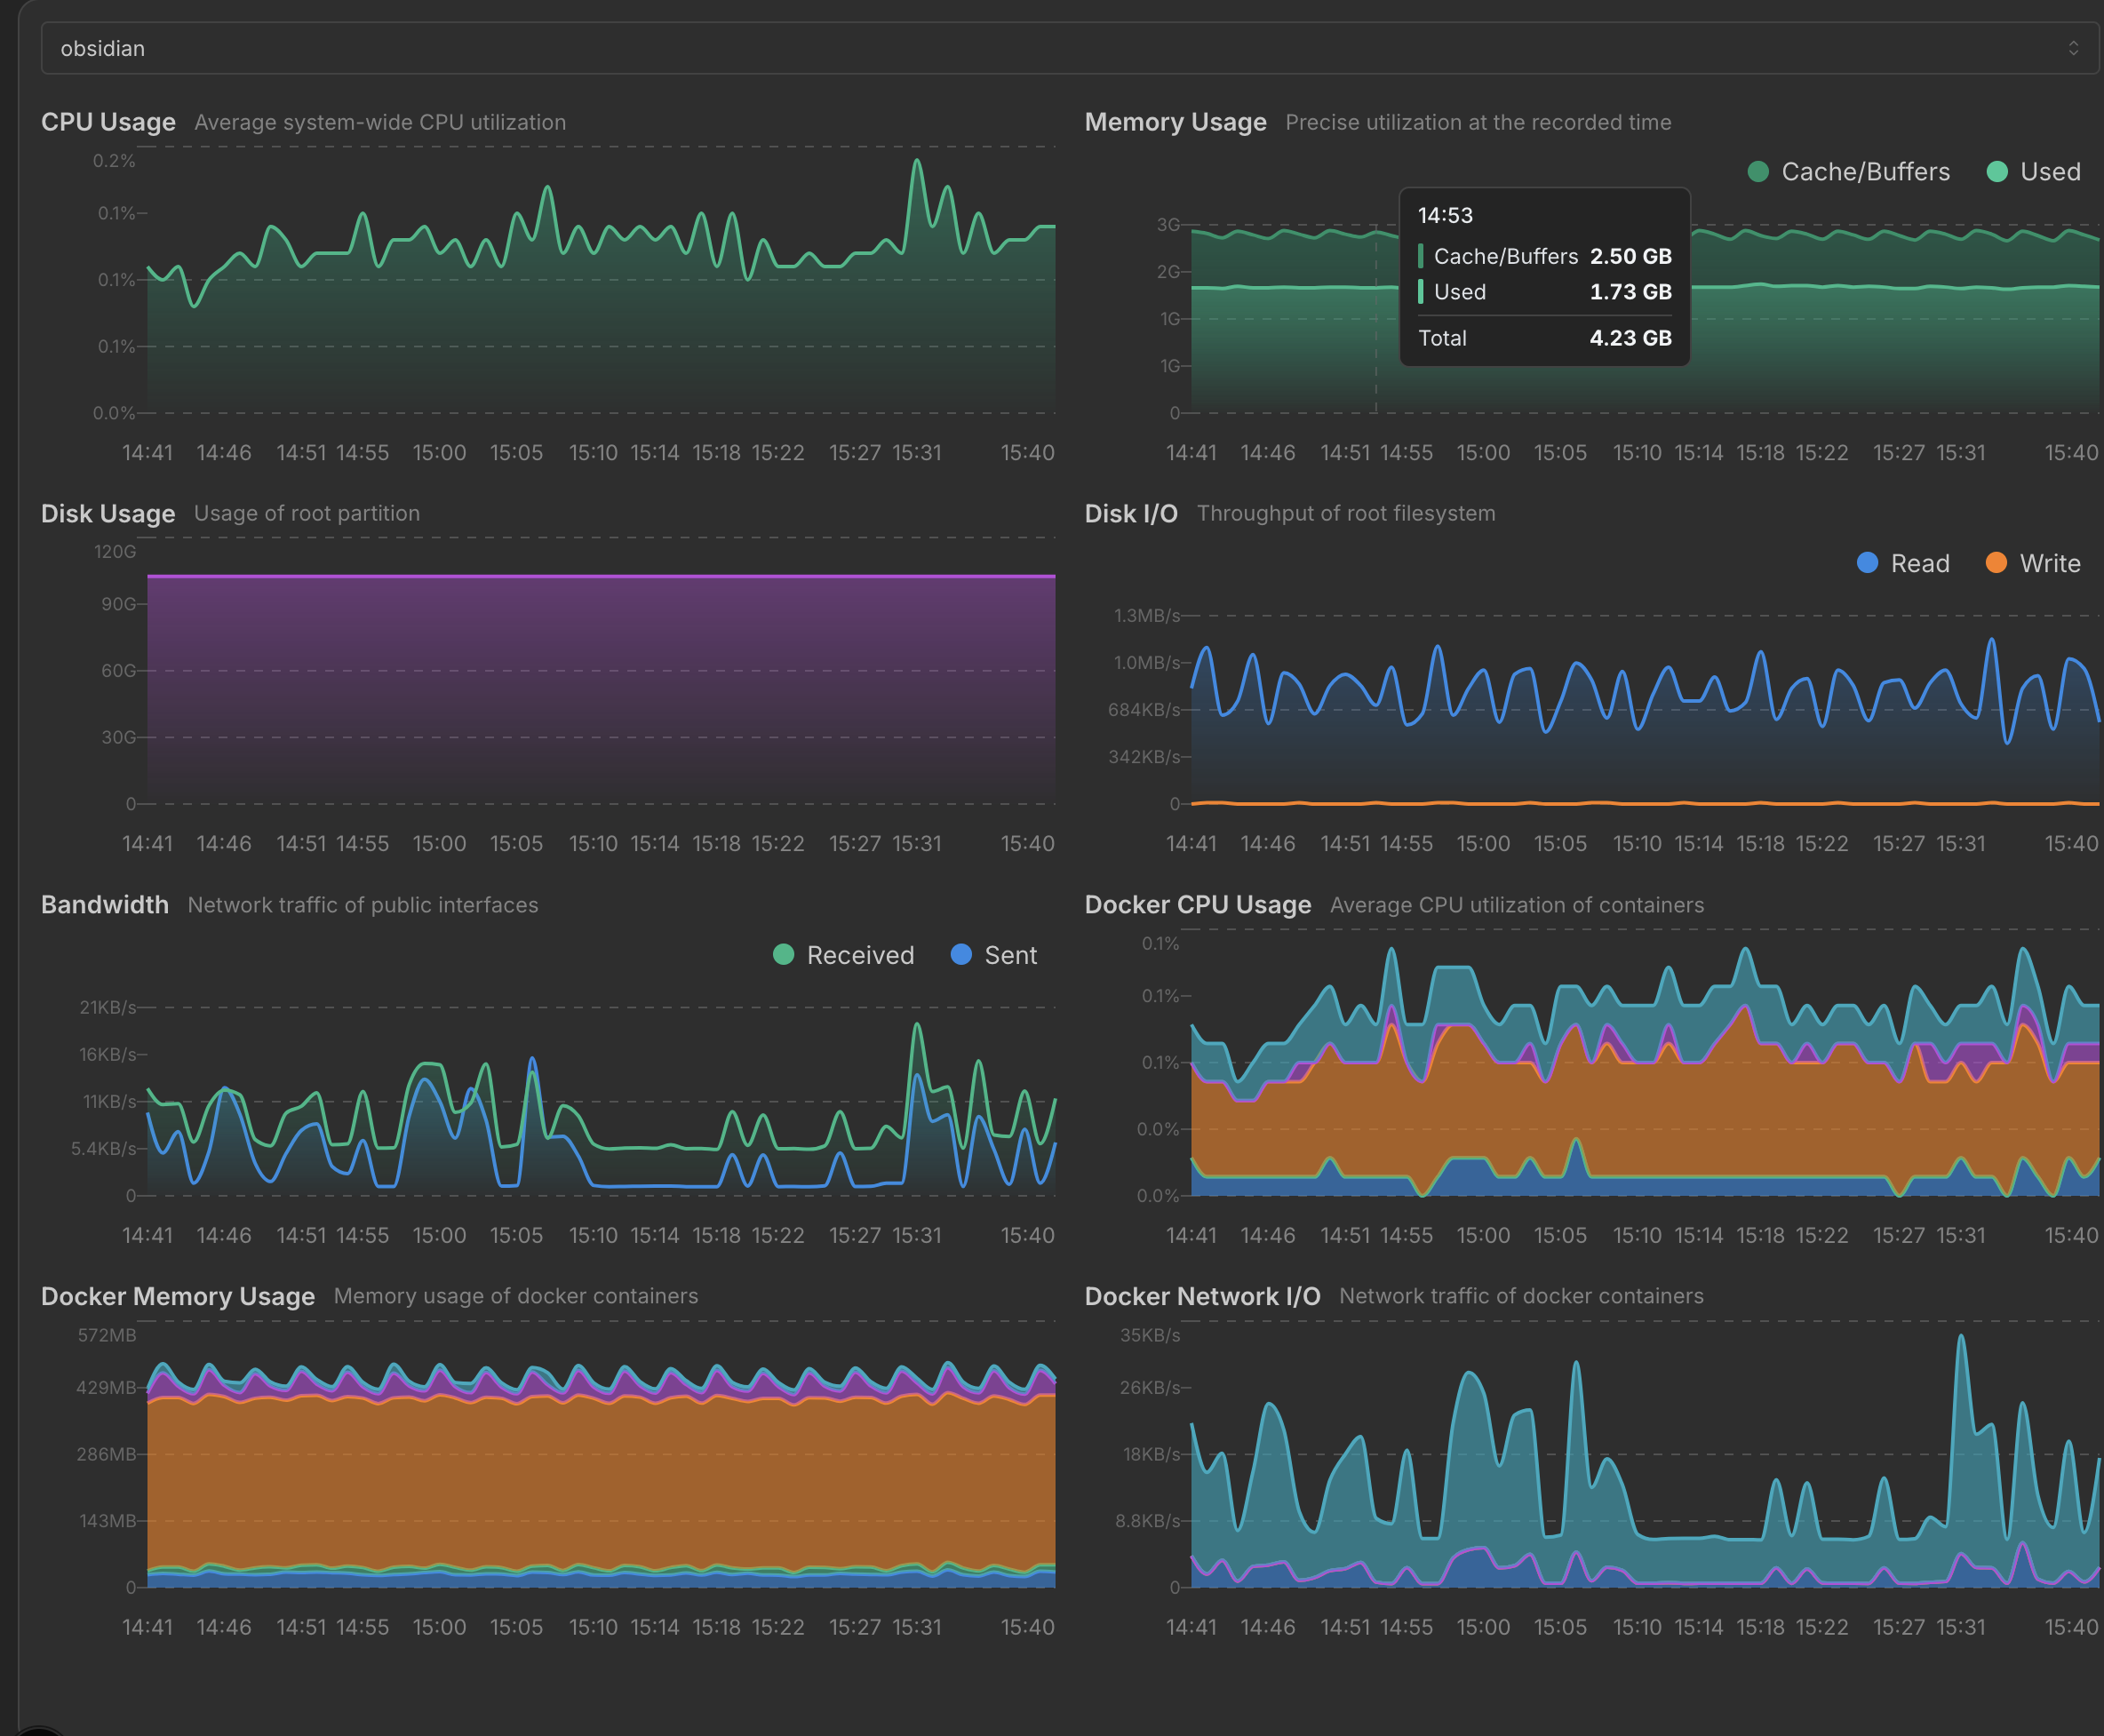
Time-series charts for CPU, memory, disk, network, and Docker container metrics from Beszel.
This widget displays time-series charts for a selected Beszel system, including CPU, memory, disk, network, and Docker container metrics. Data is cached and refreshed periodically. You can select a time period ranging from 1 hour to 30 days.
Screenshots
Supported Integrations
BeszelBeszel is a lightweight server monitoring platform with Docker stats, historical data, and alert functions.Displays time-series charts for a selected system
Adding the widget
You can find how to add the widget on the Widgets documentation page.
Configuration
| Name | Description | Values | Default value |
|---|---|---|---|
| Time period | The time range for chart data |
| 1 Hour |
| Show CPU | Displays the CPU usage chart | yes / no | yes |
| Show memory | Displays the memory usage chart | yes / no | yes |
| Show disk | Displays the disk usage chart | yes / no | yes |
| Show disk I/O | Displays the disk I/O chart | yes / no | yes |
| Show network | Displays the network chart | yes / no | yes |
| Show Docker CPU | Displays Docker container CPU usage chart | yes / no | yes |
| Show Docker memory | Displays Docker container memory usage chart | yes / no | yes |
| Show Docker network | Displays Docker container network chart | yes / no | yes |