Beszel Systems (Grid)
System Monitoring
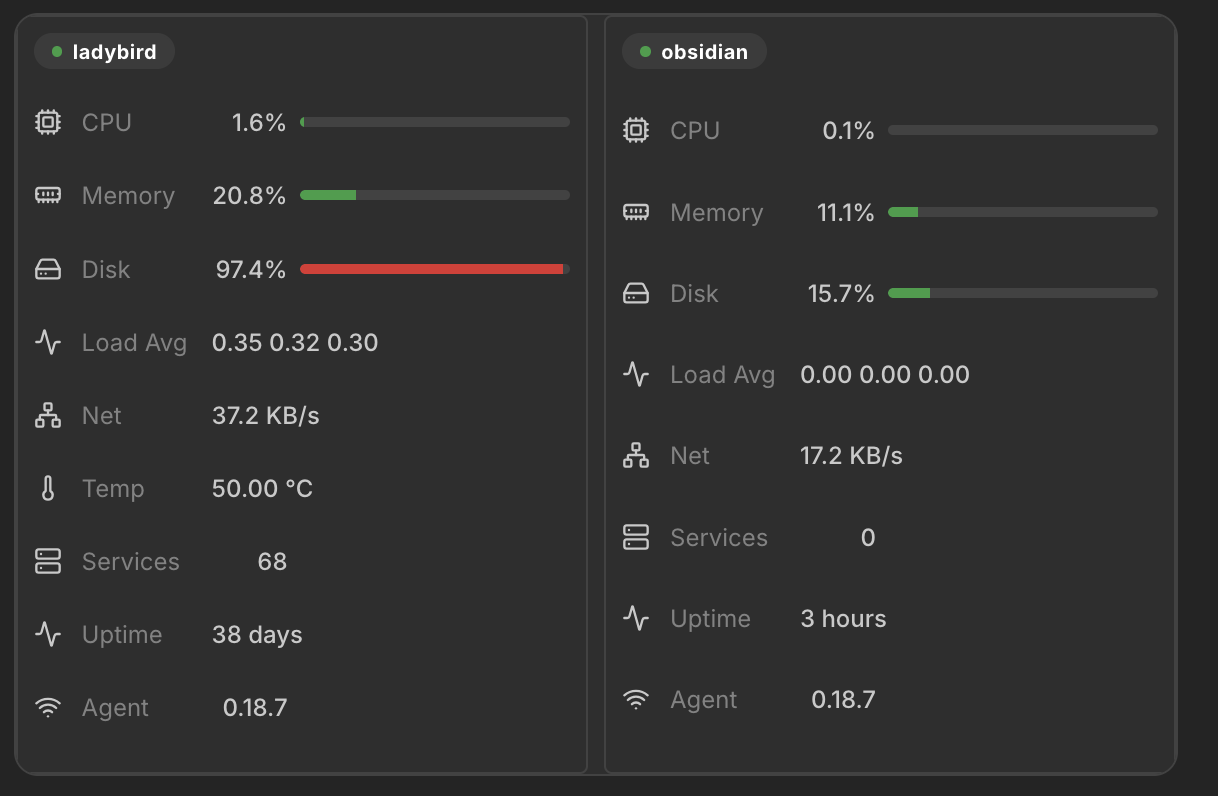
Card grid view of all Beszel-monitored systems with real-time metrics.
This widget displays all your Beszel-monitored systems as a responsive card grid. Each card shows real-time metrics like CPU, memory, disk, network, temperature, and more. Cards adapt their layout based on available space.
Screenshots
Supported Integrations
BeszelBeszel is a lightweight server monitoring platform with Docker stats, historical data, and alert functions.Displays all monitored systems as a card grid
Adding the widget
You can find how to add the widget on the Widgets documentation page.
Configuration
| Name | Description | Values | Default value |
|---|---|---|---|
| Status filter | Filter systems by their current status |
| All Systems |
| Show CPU | Displays CPU usage on each system card | yes / no | yes |
| Show memory | Displays memory usage on each system card | yes / no | yes |
| Show disk | Displays disk usage on each system card | yes / no | yes |
| Show GPU | Displays GPU usage on each system card | yes / no | yes |
| Show load average | Displays system load average | yes / no | yes |
| Show network | Displays network throughput | yes / no | yes |
| Show temperature | Displays system temperature | yes / no | yes |
| Show battery | Displays battery level (if available) | yes / no | yes |
| Show services | Displays running Docker services count | yes / no | yes |
| Show uptime | Displays system uptime | yes / no | yes |
| Show agent version | Displays the Beszel agent version | yes / no | yes |